PROFITABLE RETENTION FOR INDEPENDENT DISPENSARIES · 1 TO 10 LOCATIONS

YOUR CUSTOMERS DIDN'T STOP BUYING. THEY STOPPED BUYING FROM YOU.

87.5% of repeat dispensary customers shop every few weeks. If one hasn't been back in 60 days, a competitor has them.

Our free Retention Audit reads your POS data and shows where you're losing customers and margin.

The retention firm behind 297 independent dispensaries.

Every result verified at your POS.

Alpine IQ Preferred Partner badge and Dutchie Certified Partner logo

The elite retention team behind cannabis' most recognized dispensaries.

We've implemented successful retention systems in 297 dispensaries across 23 states.

As of October 2026.

Aunt Mary's
Buddiez (Bronx)
Dogwood Green
Garden of Eden
The Grass Station
Green Qween
Happy Valley
Herb Haus
Planet Nugg
Purple Lotus
Redi
Remedy
Seven Point
Solful
South Shore Buds
Star Buds Maryland
Sweet Flower
The Green Initiative
Valley Greens
C3 / High Profile
The Reserve
United Cultivation
All About Wellness
Cannavine
Hello High
Planet 13
Sessions by the Bay
Storehouse
The Chronic
20 Past 4
Ajoya
Alpaca Club
Apothecare
Clear Sky
Lux Leaf
Pettals
Primitiv
Stash Ventures: Cloud
Stash Ventures: Timber
Tropicanna
Truly Pure
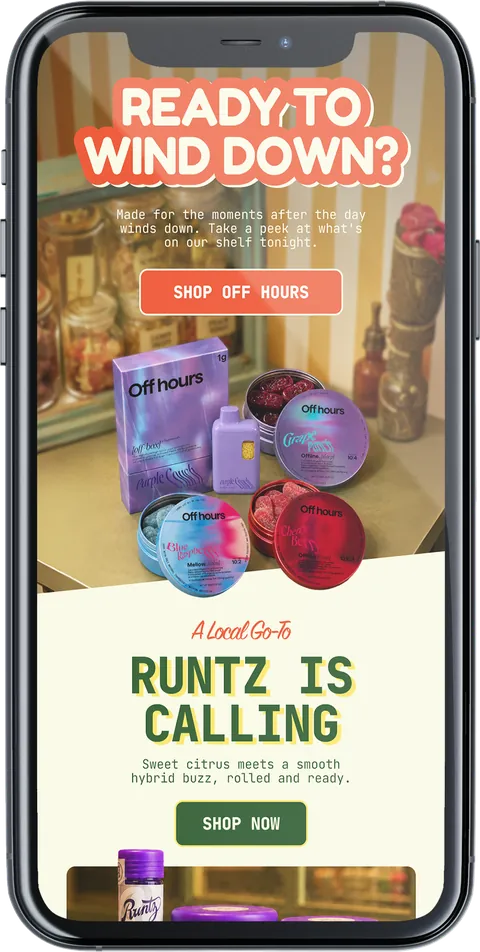
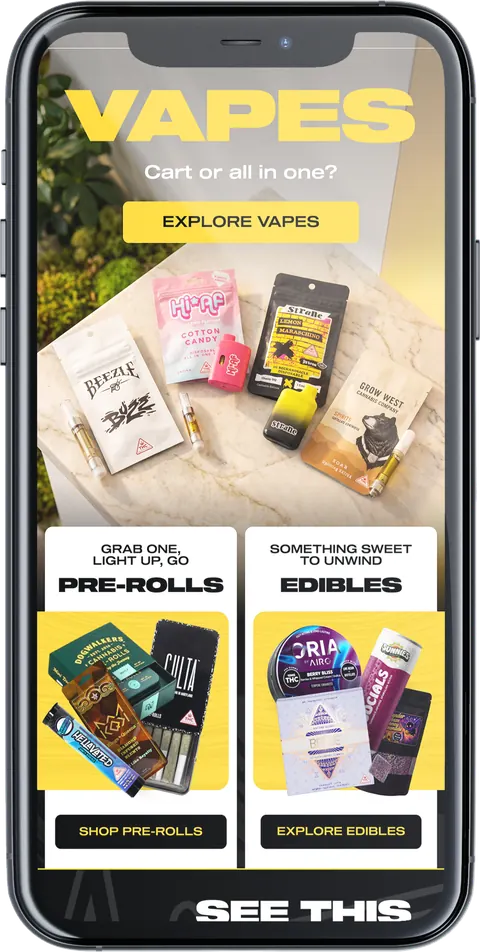
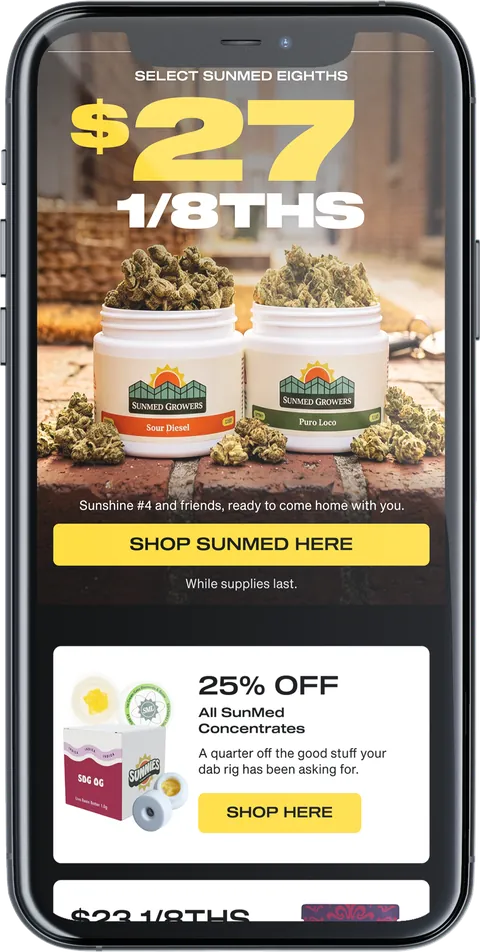
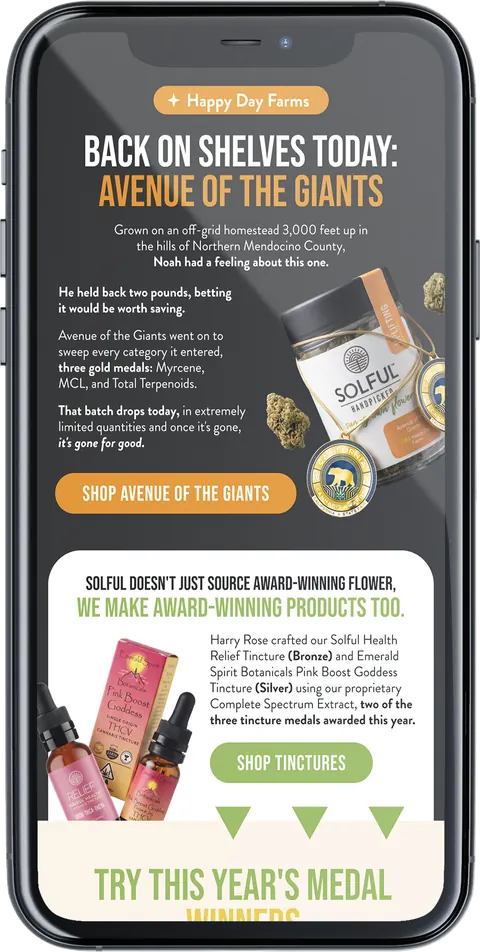
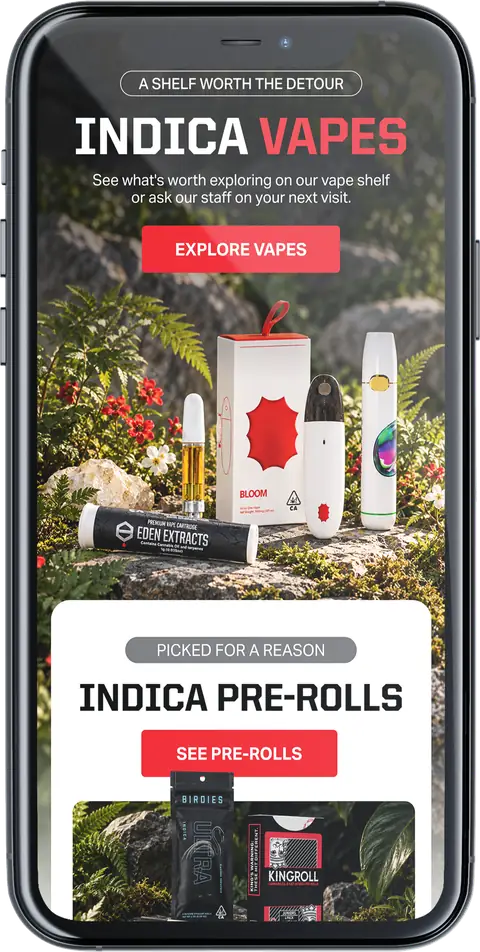
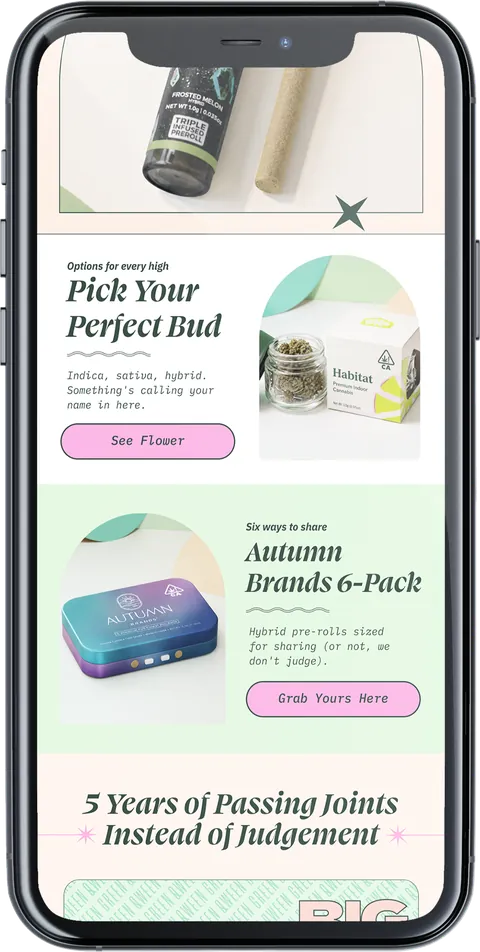
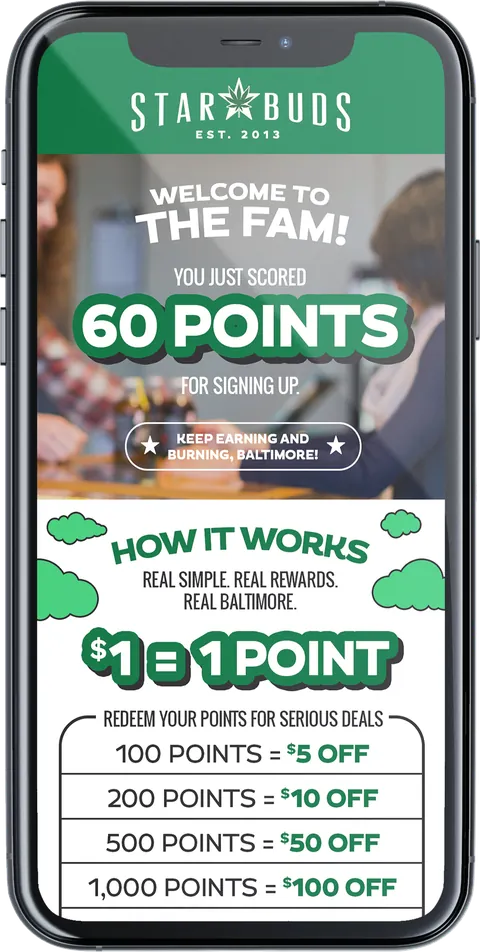
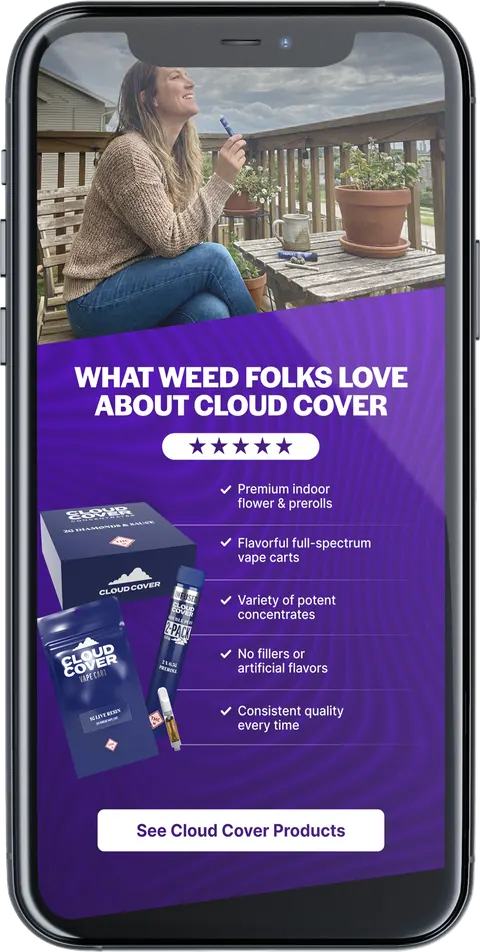
Tact campaign on a phoneTact campaign on a phoneTact campaign on a phoneTact campaign on a phoneTact campaign on a phoneTact campaign on a phoneTact campaign on a phoneTact campaign on a phoneTact campaign on a phoneTact campaign on a phone

The 4 biggest leaks we uncover in Retention Audits

Revenue comes from customers. Profit comes from the ones who come back. Most dispensaries lose them to competitors at three points, then give away margin at a fourth.

Click each number to see the leak.

Customer leaks

Margin leak

Leak 1

The opt-in

Unreachable customers

Critical Opt-In Rate

A customer you can't email or text is a customer you can't win back. When they drift, nothing stops them from becoming your competitor's regular.

Why it's not normally measured: Retail teams look at customers as a whole, but don't separate them between those you can reach and influence and those you can't.

Low sender reputation hides your emails before anyone can open them. The audit checks it.

58.5%

Across 81 stores, 58.5% of first-time customers were still unreachable by email or text a week after their first visit.

428,600 first-time customers at 81 stores (38 dispensaries), first purchase October 2025 to July 2026, opt-in on record within 7 days and not opted out since, measured October 2026.

See what we did about it

Every store has its own version of these numbers.
Our free Retention Audit finds yours.

YOUR DASHBOARD SHOWS ONE LEVEL OF RETENTION. THERE ARE FOUR MORE.

Your email platform was built to send messages, not to read your sales. It shows opens, clicks, and the revenue it gives itself credit for. That's Level 1. The four levels below it are where retention is actually won or lost. No platform measures them. We built the tools that do.

  1. Level 1: Engagement Metrics

    What your platform shows: Opens, clicks, platform-reported revenue.

  2. Level 2: Tact Retention Metrics

    Critical Opt-In Rate, First Time Churn Rate, Lost Customer Rate, and more.

  3. Level 3: locked Charts

    Inside your audit.

  4. Level 4: Profitability locked

    Inside your audit.

  5. Level 5: Strategy locked

    Tact's Retention Engine

How we verify

  • Every number comes directly from your POS.
  • We remove conversions your email platform double counts.

Most reports stop at 'did they open it?'
The Retention Audit answers 'where are you bleeding money?'

EVERY STORE WE SEE MAKES YOUR AUDIT SHARPER.

Dispensaries have trusted us with 25,601,601 customers and $3,770,976,229 in transactions. That data is behind every benchmark in your audit, and no agency can build it overnight.

September 2026 Activity

Emails sent

2,912,686

In September 2026.

Texts sent

769,315

In September 2026.

Campaigns sent

1,358

In September 2026.

September 2026 Results

What is Revenue Recovery? Our flagship strategy: we bring lapsed customers back into your store and measure every dollar they spend after they return.

Revenue recovered

$232,073

In September 2026.

Customers converted

923

In September 2026.

Revenue Generated

$620,089

In September 2026.

Revenue Recovery, all time

Revenue recovered

$9,320,209

Lapsed 60+ days, first return and every later purchase, net of discounts, confirmed at the POS.

As of October 2026.

Customers recovered

51,324

As of October 2026.

Recovered customers who bought again

56%

Second purchase within 90 days of returning.

As of October 2026.

Longest recovery

2,077 days

Days lapsed before the return.

As of October 2026.

What the Retention Audit is, and what you get

A free, deep read of your POS and CRM data: who comes back, who leaves, and where your list, your sends and your setup lose customers along the way.

The audit finds both kinds of leak: the customer leaks and the margin leak.

Your Questions Finally Answered:

  • Critical Opt-In Rate: how many first visits end without an email or a phone number on file?
  • First Time Churn: how many first-time customers didn't come back?
  • Lost Customers: who stopped buying, and how loyal were they before they left?
  • Margin Leak: did my discounts and loyalty rewards make money or give it away?
  • At which order number do our customers stop, and what is each step worth?
  • How often do our regulars shop, and when?
  • Which categories and brands do they stick to, and which do they pair?
  • Is our messaging program healthy: opens, failures, list decay?
  • Where do customers slip away, and what is worth fixing first?

Thirty-plus pages, every number measured from your own data.

You get it in 4 to 5 business days, explained in depth by Steve (Tact's Founder).

665 store-locations audited. As of October 2026.

05LIFETIME VALUE BY PURCHASE STAGENot Opted-InEngaged$64$972nd$104$1513rd$176$2595th$342$49710thFIRST PURCHASECustomers9,412Revenue$386,204LTV$41Move on47%Stop here53%LOST = 89%2NDCustomers4,418Revenue$213,377LTV$83Move on69%Stop here31%LOST = 83%3RDCustomers3,137Revenue$164,925LTV$127Move on74%Stop here26%LOST = 78%Tact FirmYOUR STORE06OPEN RATES*this measures the health of your messaging program29%EMAILWEAKHEALTHYSTRONG17%SMSWEAKHEALTHYSTRONGSHOP WITHIN 1-10 DAYS33%WITHIN 1-30 DAYS61%WITHIN 1-45 DAYS74%Measured at your POSsample

What 665 store audits taught us

Patterns like these only show up after you've dived deep into hundreds of stores' systems. It's why our free Retention Audit knows where to look in your data.

Most second purchases come fast, or never.

50% of second purchases happen within 32 days of the first visit, and 75% within 118. Only 46.0% of first-time customers ever buy again.

32118days50%75%

1,485,329 returning customers at 46 dispensaries, active clients only.

A low open rate is money leaving quietly.

A seven-store Michigan dispensary group averaged a 14.25% email open rate over 11 months. 85.75% of its sends were never opened: about 86 cents of every dollar it spent on email bought a message nobody opened.

14.25%85.75%open ratenever opened

3,504,352 sends, October 2025 to August 2026. Anonymised audit client.

WHAT HAPPENED WHEN WE FIXED THEM

Four leaks. Four real stores. Measured through the POS.

When your POS records cost, we report gross margin. When it doesn't, we report discount depth against your storewide average.

Leak 1: Unreachable customers

Sweet Flower, 6 stores, California

Fixed opt-in capture at the counter and rebuilt the welcome flow, then measured new-customer opt-in month by month.

  • 21.5% Opt-in rate, early 2025
  • 61.0% Opt-in rate, August 2026
  • 25,189 New-customer emails captured above the old 15.6% email baseline, March 2025 to September 2026

Opt-in rates above count email or text, as on record today. In August 2026, 60.7% opted in within 7 days of their first purchase. Email-only baseline 15.6% = January and February 2025.

The leak

Leak 2: First Time Churn

A two-store dispensary

Built the first-purchase follow-up and counted the second purchases the POS recorded in May 2026.

  • 159 First-time customers converted to a second purchase, May 2026
  • 3.34 Further purchases since, on average
  • 47.8% Made two or more

Second purchases the email platform credited to a Tact-built campaign. Further purchases counted through October 4, 2026.

The leak

Leak 3: Lost customers

Remedy, 2 stores, Maryland

Sent win-back emails to customers who had not bought in 60 days, and matched every return to the POS.

  • 15.6% Lost customers emailed a win-back who came back
  • 61.4% Of those, bought again within 90 days
  • 20.1% Had been gone more than a year
  • 4,588 Lost customers won back

Cumulative, all history to September 30, 2026. Each customer counts once, at their first return. The 90-day share counts returns matured by July 2, 2026.

The leak

Leak 4: The margin leak

A Northern California 4-store client

Compared the store's own second and third visit offers with Tact's second, third and fourth purchase funnel, on the same discount-depth basis.

  • 37.5% Store's own 2nd and 3rd visit offers, discount depth
  • 16.1% Tact's 2nd, 3rd and 4th purchase funnel
  • 21.3% Storewide average

Discount depth

Measured as discount depth against the storewide average, where the POS records no product cost.

June 1 to July 16, 2026, Pacific dates. Discount depth is the discount as a share of the price before discount.

The leak

Lapsed customers won back, by state. A state appears only when two or more of our clients are in it.

California

In California, our programs won back 7,099 lapsed customers who went on to spend $1,853,270.

As of October 2026.

Colorado

In Colorado, our programs won back 1,537 lapsed customers who went on to spend $234,182.

As of October 2026.

Connecticut

In Connecticut, our programs won back 117 lapsed customers who went on to spend $22,880.

As of October 2026.

Illinois

In Illinois, our programs won back 278 lapsed customers who went on to spend $88,607.

As of October 2026.

Maryland

In Maryland, our programs won back 4,501 lapsed customers who went on to spend $890,761.

As of October 2026.

Massachusetts

In Massachusetts, our programs won back 11,056 lapsed customers who went on to spend $1,545,351.

As of October 2026.

Michigan

In Michigan, our programs won back 11,393 lapsed customers who went on to spend $1,622,639.

As of October 2026.

Missouri

In Missouri, our programs won back 124 lapsed customers who went on to spend $21,491.

As of October 2026.

New Jersey

In New Jersey, our programs won back 7,862 lapsed customers who went on to spend $1,749,071.

As of October 2026.

New Mexico

In New Mexico, our programs won back 1,131 lapsed customers who went on to spend $207,894.

As of October 2026.

New York

In New York, our programs won back 888 lapsed customers who went on to spend $200,930.

As of October 2026.

Ohio

In Ohio, our programs won back 59 lapsed customers who went on to spend $11,440.

As of October 2026.

Oregon

In Oregon, our programs won back 512 lapsed customers who went on to spend $49,896.

As of October 2026.

Washington

In Washington, our programs won back 2,372 lapsed customers who went on to spend $263,039.

As of October 2026.

What operators found

"We thought our store had better retention until Tact discovered we weren't looking at the right metrics."

David Morgan, Owner, South Shore Buds1 store, Massachusetts

"Our Lost Customer Rate was above average, and Tact Firm helped us win back tens of thousands of lost customers."

Joe Becker, Marketing Director, Stash Ventures14 stores, Michigan

HOW WE WORK WITH YOUR STORE

WHERE STORES LIKE YOURS START

The audit decides what's worth fixing first. Here's where most stores your size begin.

SINGLE STORE $300K to $500K / month

Starts with

  • 2 to 3 Weekly Retention Campaigns
  • Lifecycle Automations
  • Quarterly Reporting

Why

Build the repeat habit first. Turn first visits into second and third, and keep your regulars from drifting to the store down the street.

SINGLE STORE $500K+ / month

Starts with

  • Revenue Recovery
  • 3 to 4 Weekly Retention Campaigns
  • Advanced Funnels
  • Quarterly Reporting

Why

At your volume, lapsed regulars are the fastest money. We win them back first, stay in front of the rest 3 to 4 times a week, and run deeper automations for every stage of the customer journey.

2 to 4 LOCATIONS Any revenue

Starts with

  • Revenue Recovery, per location
  • 2 to 4 Weekly Retention Campaigns
  • Advanced Funnels
  • Monthly Reporting, per location

Why

Every location leaks differently. Recovery and reporting run store by store, so you see which location needs what.

5+ locations or multi-state? We work as retention consultants alongside your team. Talk to us

Not sure which one you are? The free audit tells you.

Here's what we do

Wins back the regulars who stopped coming. We find every customer who hasn't shopped in 60+ days, confirm the lapse at your POS, and incentivize them to come back with many not even needing a coupon to purchase again. We measure what they spend after they return, margin, discount rate, redemption rate, and more.

REVENUE RECOVERED*Illustrative figuresYOUR STORERecovered revenueRepurchase share$34KJ$42KF$49KM$57KA$66KM$78KJ42%CUSTOMERS WON BACK386AVG DAYS LOST143REVENUE RECOVERY: PAST MONTHS(last 6 months only)MonthRecoveredRevenueRevenueCampaignRepurchasesPast CohortShareRepurchaseJanuary$34,000$120,45036828.2%February$42,000$135,48045131.0%March$49,000$144,12052134.0%April$57,000$154,05059937.0%May$66,000$168,93068739.1%June$78,000$185,71080342.0%Total$326,000$908,7403,42935.9%sample

Where we've worked

Hover a state for our all-time impact there.

Our programs have run in these 23 states.

  • Arizona
  • California
  • Colorado
  • Connecticut
  • Florida
  • Illinois
  • Kentucky
  • Maryland
  • Massachusetts
  • Michigan
  • Minnesota
  • Missouri
  • Nevada
  • New Jersey
  • New Mexico
  • New York
  • Ohio
  • Oregon
  • Pennsylvania
  • Rhode Island
  • South Dakota
  • Vermont
  • Washington

What clients say

"TACT helped us recover revenue from customers who had previously churned, and they did so in a way that was strategic, efficient, and grounded in solid analytics."

James Long, review on Trustpilot

"Every month, they over-delivered on results. We saw a great return for the work they did."

C Rush, review on Trustpilot

"...a program that is essential to any cannabis retailer's growth."

Anthony Parrinello, review on Trustpilot

"...continues to help us improve and shape our customer experience and retention in our retail businesses."

Michael Spengler, review on Trustpilot

Read every review on Trustpilot

QUESTIONS OWNERS ASK

Is the audit really free? What's the catch?

Yes, it's free. The catch is that we're betting what we find will make you want to work with us. Either way, you keep the findings, and you get them in 4 to 5 business days.

Who is the audit for?

Independent dispensaries with 1 to 4 locations, 5+ locations, and even MSOs. If you already pay for Alpine IQ (AIQ) or Dutchie and can't tell whether it's working, the audit is built for you. Running 5+ locations or a multi-state operation? We work with you as retention consultants to amplify your current marketing team. Ask us on the first call.

What do you need from us for the audit?

Access to your platforms for a thorough audit. We confirm the details on the first call.

Is our data safe?

Your data is used only for your audit and your programs. We never sell or share it, and you can revoke our access at any time.

What does Tact cost?

Pricing depends on how many locations you have and which programs we run to solve the issues we discover in the audit. You'll get exact numbers on your audit call.

Do you work with Dutchie stores?

Yes. Tact is a Dutchie Certified Partner. For Dutchie stores, we credit each sale to the last email or text a customer actually engaged with, not every purchase after a send.

We don't use Alpine IQ, Dutchie, or SpringBig. Can you still help?

Yes. We help you choose a loyalty platform that fits your store, launch it, and build your opt-in list from the first day. If you're on another platform, we'll tell you on the first call whether we can audit it.

We have our own marketing team. Do we still need you?

We work alongside in-house teams. We sync to your promotional calendar and handle the platform work, so your team can focus on your website, social and everything else. And the audit shows your team exactly where to focus, whether or not you hire us. We have a team of 20+ retention experts and all we do is retention every day, so it allows us to go deep in retention at your store and your team can focus on other productive areas.

What if we're a brand new store?

The audit needs at least 3 months of sales history. Until then, start with opt-ins. We work with your retail team to get new customers to opt in at the counter, then start the welcome flow from their first visit.

Steve Riparip, founder of Tact Firm

WHO'S BEHIND YOUR AUDIT

Steve Riparip brought 15+ years of creative experience into cannabis in 2018, and watched great retailers bleed customers they'd already paid to win. Their dashboards showed loyalty points and open rates. Nothing showed them who left, or why.

He started Tact Firm to fix that: retention systems that drive profit, measured at the POS. No generic best practices. No vanity metrics. Since then, Tact has audited 665 stores and run retention programs for 297 dispensary locations across 23 states, and every audit is reviewed by our team before it reaches you.

Follow Steve Riparip on LinkedIn (opens in a new tab)

Anyone can press send. We prove what it did.

The Retention Audit is a free, deep read of your POS and CRM data. It shows where you are losing customers and margin, and what is worth fixing first. You get it in 4 to 5 business days. We take a limited number each month, for owners and operators of licensed dispensaries.

Rather pick a time now? Book a call.

Request your Retention Audit

A human replies within one business day.